Artemis Monthly insights
Overview
-
✉️ Artemis Monthly Insights was a pilot initiative that delivered tailored data summaries straight to clients’ inboxes. Helping them spot key trends without needing to log in. By partnering across multiple departments, we launched to 25 clients with zero additional engineering efforts.
Results
-
📬 Launched to 25 direct clients
-
📈 Avg +1 pt increase in Net Promoter Score (NPS) from pilot clients
-
🚀 Early launch, high client value, zero additional eng. effort
-
🤝 Improved client relationships by helping analysts get ahead of trends
-
🧠 Machine learning model refined with each new data refresh

Duration
Jul '23 - Jul '24
Deprioritized (Oct '23 - Apr'24)
Challenge
Deliver measurable value by transforming how clients receive & engage with their data.
Team
-
UX (That's me)
-
Product & Engineering
-
Data Science
-
Analytic Advisors
Constraints
Limited engineering availability due to code migration
Gap in Analytic collection due to tool migratio
Problem
Nearly one-third of user accounts have never logged in.
After integrating a new analytics platform FullStory, we aimed to set KPIs around user engagement, but before defining those goals, we needed to understand current user behavior.
I discovered that nearly one-third of user accounts had never logged into the platform. This raised both a usability concern and a deeper strategic question: Why weren’t they engaging?
-
Do users not see the value they’ll get from logging in?
-
Is the onboarding experience unclear?
-
Are users expecting insights to come to them?
-
Are we targeting the right users?
-
Are there technical or access issues with logins, permissions?

Approach
Design by behaviors
We could see WHAT was happening through tools like FullStory, but we didn’t understand WHY? To make meaningful improvements, I needed to pair the quantitative patterns we were seeing with real user perspectives through qualitative research.
Attitude & Behaviors Insights
To really understand this problem, you must first understand the different needs, experiences, behaviors of our different customers.
This assumption was used in making design tradeoffs between power &approachability.


Discovery
To get to the root of the problem, I conducted over a dozen interviews across our key personas. I discovered that Executives never planned to log in, Instead, they trusted analysts to deliver the insights that mattered.
However, these managers only had ~20 minutes in executive meetings. Most of which they spent providing background, not analysis.
Benefits managers have roughly 20 minutes to present their annual strategy - half of that time is spent bringing executives up to speed.
Shift in Goals
We redefined success. Rather than drive logins, we focused on delivering value where users already were.
1. Deliver valuable insights
Ensure clients receive value, whether they log into the platform or not
2. Promote healthcare literacy
Increase data-driven decisions, a core value of Artemis
3. Encourage deeper exploration
Invite users into the platform when they're ready, with relevant and timely data as the hook
Ideate & Collab
I facilitated brainstorming sessions with clients and internal stakeholders to identify which reports and metrics would be the most valuable on a recurring basis.
Top Requests:
-
Spend - breakdowns
-
High Cost Claimants


Prototypes
I drafted sketches and low-res wireframes to keep things fast and flexible.
The goal was to explore how users could subscribe to key reports and share with their teams. Turning insights into a regular, effortless touchpoint.

Usability Testing
"We’d definitely need a Q/A step before this ever goes to a client. There’s no way we’d send data without reviewing it first."
-Matt G.
Senior Principle Advisor - Broker Client
"We would need the PMPY trends opposite enrollment trends"
-Corey W.
Benefit Analytics Specialist - Direct Client
I tested the prototype with several of our key clients, including consultants & brokers. These sessions helped bring to surface some practical needs and gaps that we hadn't yet considered.
One major theme: personalization was non-negotiable. Clients each wanted different filters and metrics in their reports — if they couldn’t tailor it, it wouldn’t be useful.
From our broker clients, another key insight emerged: automated sharing wouldn't be feasible without a review step. They needed visibility and control before anything went to their clients.
These sessions did more than validate usability, they helped refine the solution’s core logic while keeping us aligned with our user's trust.
Pump the Breaks
Just as we were preparing for next steps, a company-wide shift in priorities put our project on hold. Engineering efforts were being redirected to a major code migration, which paused all non-critical development. That included, you guessed it... this project.
Shift in Strategy
Fast forward to March 2024, engineering resources were still consumed by the code migration, and any updates to the core product remained on hold.
We knew we had something valuable on our hands with this concept, but didn’t want to wait months to act on it. So I partnered with our Data Science team to ask: "How can we deliver insights with the data already available to us, given our engineering resources?"
We realized that while we couldn’t build the in-platform experience yet, we could still deliver meaningful insights. That idea became the pilot for Artemis Monthly Insights: a scrappy but scalable way to get timely insights into clients’ hands without waiting for full platform integration.
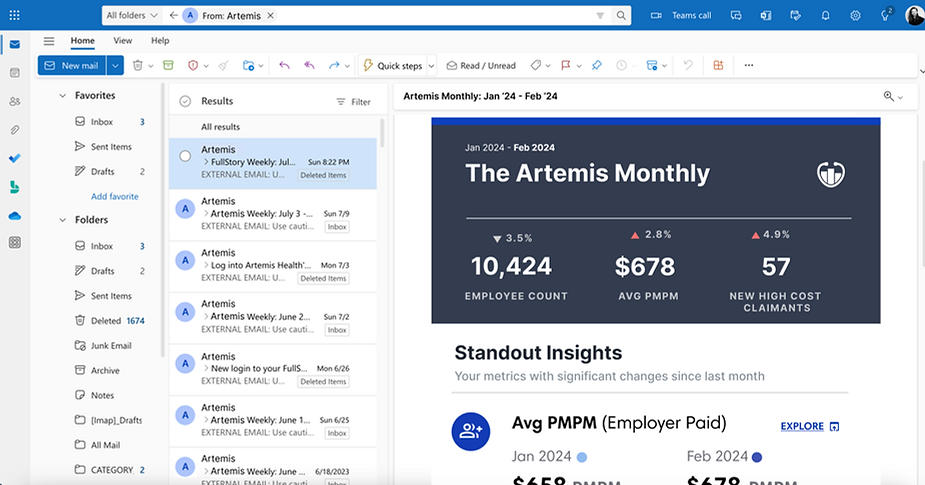
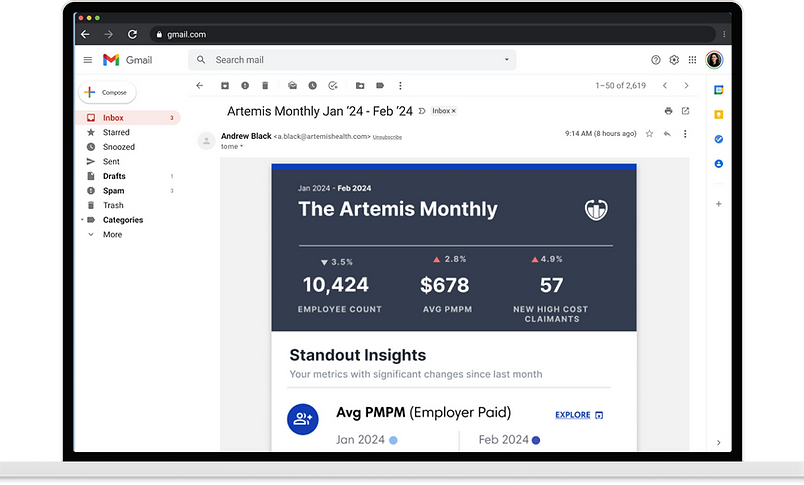
Artemis Monthly Insights: a pilot initiative built to deliver unique & tailored insights directly to a client’s inbox, following their latest data refresh.
Designing the Template
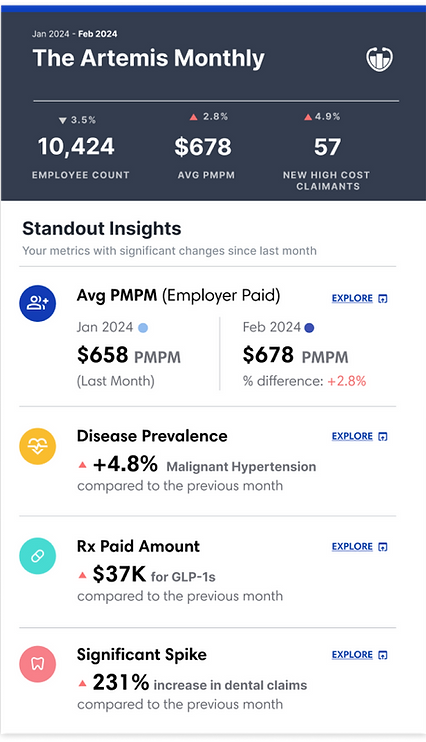
I created a simple, scannable email template that made the insights instantly digestible.
The top level featured a few universally valuable metrics, things nearly every client cared about.
Below that, we highlighted tailored trend insights based on what had changed most since the client’s last data refresh.
Each section would link back to the Artemis platform, giving users a clear path from high-level insight to detailed exploration.
Making It Real
We used DOMO to build a report that mirrored the design I had mocked up. From there, analysts could simply filter by client to surface insights specific to their data.


Making it Scalable
Once in DOMO an analyst would...
-
Filter by Client
Analysts applied filters to surface metrics and trends specific to each client’s latest data refresh.
-
Quality Review
Each report was reviewed to ensure accuracy and data integrity.
-
Export + Share
Analysts exported the report and emailed it to their client. Delivering clear, relevant insights straight to the inbox.
-
Feedback Loop
Within 2–3 business days, analysts follow up with a NPS survey to gather feedback.
Pilot Launch
We launched the first iteration with 25 direct clients, this allowed us to move quickly without the added constraints of broker distribution.
What We Heard
We tracked Net Promoter Score (NPS) with the 25 pilot clients and saw an avg of a modest but meaningful 1-point increase during the pilot.
Early feedback was overwhelmingly positive. Clients appreciated the simplicity of the format and the fact that the insights were immediately relevant to their latest data.


What We Saw - 60 days
Despite shifting focus, engagement rose and became a gateway to deeper dialogue, prompting useful client questions and deeper platform interest.
39
New Client log-ins
904
Number of events
271
Number of sessions
What I'd do...
Differently
-
I would’ve ensured we had a backup way to track engagement. We had a gap in our analytics during June which meant we missed open and click data, making it harder to tie emails to logins.
-
Some clients said, “This is great, but what am I supposed to do with it?” I’d add more context and clear calls to action to help users understand what steps they could take next.
Next
-
Build the workflow into the platform so clients can manage their subscriptions directly.
-
Continue collaborating with Data Science to refine how we surface meaningful trends and ensure relevance for each client.
Learnings
This low-lift, scalable approach gave us a way to test the concept, gather feedback, and deliver meaningful value without waiting on additional engineering resources.
Most importantly, it reminded us that true value comes from aligning with user behavior, not expecting them to change.
Engagement ≠ value. Meeting users where they are was the real win.